Our Focuses|Climate Change Management|Scenario Analysis
Climate Change Management
Winbond embraces the vision of being an "Be a hidden champion in providing sustainable semiconductors to enrich human life". In response to international guidelines and domestic policies geared towards green sustainability, Winbond has implemented the Task Force on Climate-related Financial Disclosures (TCFD) framework for the third year to assess the potential climate change risks and opportunities as the basis for promoting climate mitigation and adaptation actions, enhancing the company's operational resilience.


Publish the first independent TCFD report in 2023
Establish twelve Climate-Related Management Metrics
12

Scenario Analysis
Transition Risk Scenario Analysis
Considering Winbond is a group based in Taiwan with a global market perspective, three scenarios were adopted
for transition risk simulation. In addition to examining the risks of current domestic regulations, the impact of
international carbon reduction trends was also included in the assessment.
Winbond conducted risk simulations using three scenarios: (1) National Net-Zero Pathway, in Taiwan which mainly assesses domestic regulatory risks, (2) The SSP1-1.9 scenario from the Intergovernmental Panel on Climate Change (IPCC) Sixth Assessment Report, which represents an extremely low-emissions pathway, and (3) an annual reduction rate of 4.2% as required by the Science-Based Targets Net-Zero (SBT-NZ) Standard for carbon emissions. The scope of the transition risk scenario analysis covers the group's main fabs and offices.
| External Scenario | Description | Assessed sources of emissions |
|---|---|---|
| National Net-Zero Pathway | Based on Taiwan's current net-zero target | Scope 1 + Scope 2 |
| SSP1-1.9 | Based on the SSP1-1.9 pathway in the IPCC Sixth Assessment Report | |
| SBT-NZ | Based on the emissions reduction pathway required to achieve the SBT's net-zero criteria by 2050 |
Note: The Scope 1 and Scope 2 carbon emissions after 2025 were estimated data. The estimation was calculated by comprehensively considering the actual emissions in 2024, the future medium- and long-term average emission growth trends, and the predicted values of the electricity emission factor.
The issue of climate change is expected to have financial impacts on Winbond in terms of regulations, technology,
market, and reputation. Among these, the introduction of carbon tax/carbon fee and fee, compliance with regulations for intensive electricity users to use of renewable energy electricity are estimated to result in a financial impacts of approximately NT$ 0.2~7 billion by 2030, which is about 0.3%~9% of revenue in 2024 .

Financial Impact of 2030 Issues on Revenue
Physical Risk Scenario Analysis
Winbond follows the IPCC’s Climate Models to evaluate the risks of flooding, debris flows, and landslides resulting from extreme precipitation. We conduct scenario simulations using data from the Taiwan Climate Change Projection Information and Adaptation Knowledge Platform (TCCIP), National Science and Technology Council (NSTC), National Science and Technology Center for Disaster Reduction (NCDR), and various climate models to avoid biased results.
Risk value = Hazard × Vulnerability × Exposure

Risk value
- Risk of flooding, debris flows, and landslides
- Categorized by risk level:
| Level | Risk Value |
|---|---|
| Low Risk | 0-12 |
| Moderate Risk | 13-25 |
| Moderate Risk | 26-50 |
Hazard
- Extreme rainfall: Possibility of cumulative rainfall reaching 650 millimeters within 24 hours
- Four scenarios: RCP 2.6, RCP 4.5, RCP 6.0, RCP 8.5
- Categorized by hazard level:
| Level | Return Period |
|---|---|
| 1 | 1000 Years |
| 2 | 500 Years |
| 3 | 100 Years |
| 4 | 50 Years |
| 5 | <50 Years |
Vulnerability × Exposure
- Flood potential
Defined based on the criteria set by Water Resources Agency of the Ministry of Economic Affairs and the government's flood relief qualifications
| Level | Flood Magnitude Class |
|---|---|
| 0 | No potential |
| 1 | 0.3-0.5 m |
| 2 | 0.5-1.0 m |
| 3 | 1.0-2.0 m |
| 4 | 2.0-3.0 m |
| 5 | >3.0 m |
- Debris flow potential
Defined based on the criteria set by Soil and Water Conservation Bureau of the Council of Agriculture, Executive Yuan
| Level | Potential Magnitude of Class |
|---|---|
| 0 | No potential |
| 1 | Continuous Monitoring |
| 2 | Low |
| 3 | Moderate |
| 4 | High |
- Landslide potential
Defined based on the criteria set by Central Geological Survey of the Ministry of Economic Affairs
| Level | Potential Magnitude of Class |
|---|---|
| 0 | No potential |
| 1 | Intersected |
The following results show that by the end of the 21st century, Winbond’s main fabs and offices (including the CTSP Fab, Kaohsiung Fab and Zhubei Building) have a risk level of 0 (low possibility of flooding, debris flows, and landslides) under the four global warming scenarios.
Flooding vulnerability
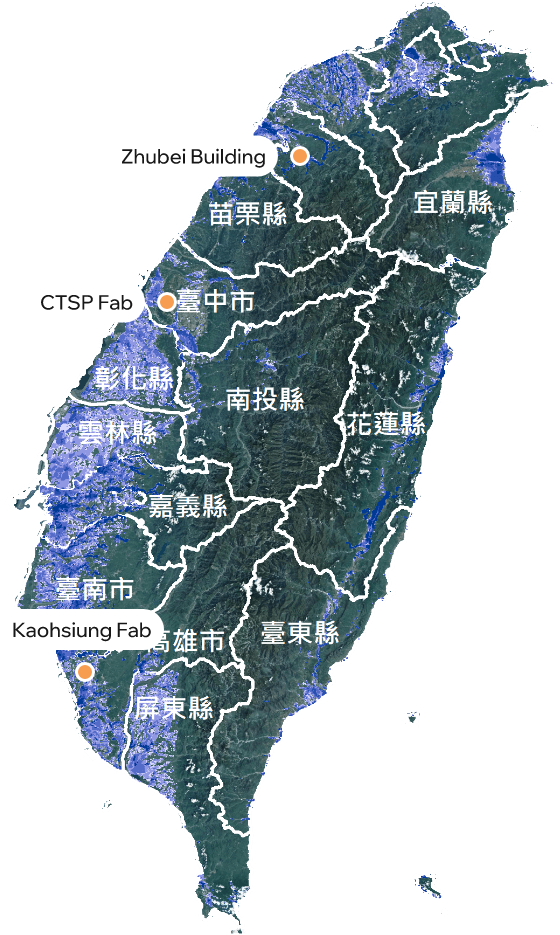
Potential flooding distribution

Debris flow hazard level
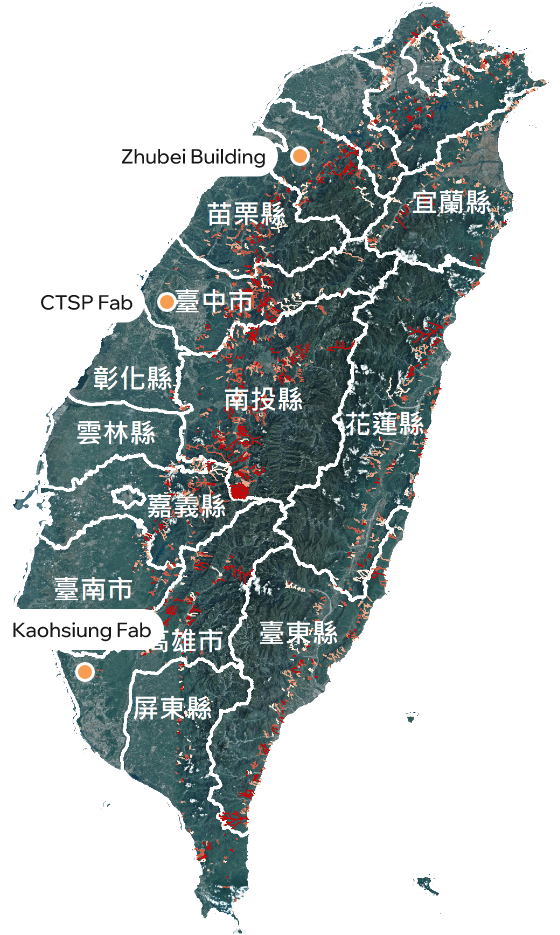
Potential debris flow torrent

Landslide vulnerability
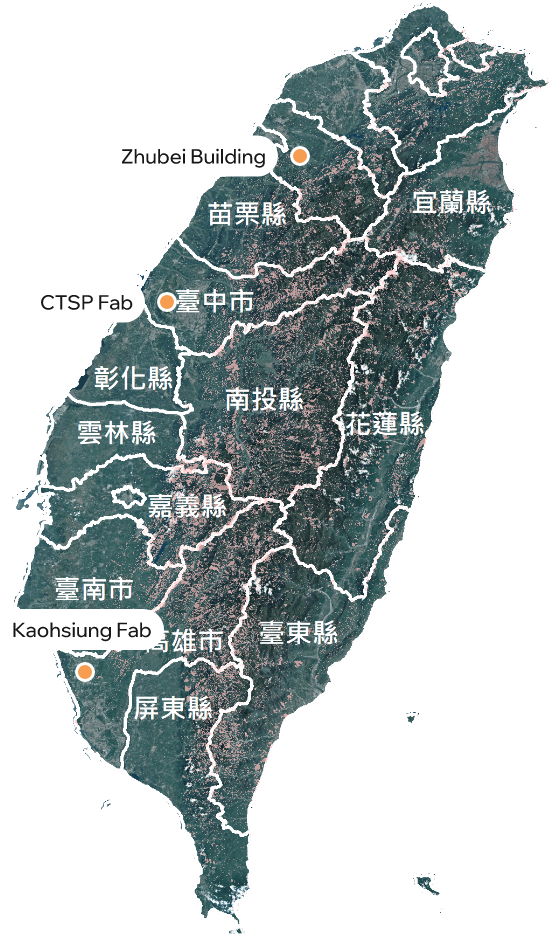
Landslide-prone geologically sensitive area
