Our Focuses|Environmental Sustainability|Energy and Carbon Emissions Management
Environmental Sustainability
Winbond has worked alongside countries and companies from around the world to implement green sustainability measures, proactively reducing the impact that our business operations have on the environment. Apart from having no major violations of environmental laws, Winbond has also committed innovative new technologies and significant resources into adopting measures for reducing energy consumption and carbon emissions, improving resource utilization rates, and improving waste and emissions management, taking concrete action to implement our sustainable development blueprint.


SBTi (scope1+scope2)
15
%
The water recovery rate of the whole plant reached
82.7
%
Removal rate for VOCs in 2023 reached
99
%

Energy Management
Winbond adhered to the vision of "Being a hidden champion in providing sustainable semiconductors to enrich human life." fulfilling its responsibility for green manufacturing, reducing the environmental impact of corporate operations, enhancing product value while conserving energy and improving efficiency, and investing resources to support equipment energy optimization, aiming to fulfill social responsibility and achieve sustainable operations.
All Winbond manufacturing plants have passed ISO 50001 energy management systems certification, expanding the scope and efficiency of energy management.In 2025, electricity savings increased by approximately 88,236 GJ compared to 2024. For historical energy usage and energy intensity data, please refer to the annual sustainability report.
See Winbond Climate Change and Energy Management Policy、 Certification and Verification
Target Achievement Progress
Winbond the electricity reduction target is to reduce the electricity consumption per unit product by 1% YoY per year by 2030.
| Indicators and Targets | 2024 | 2025 | YoY achievement status |
|---|---|---|---|
| Electricity Intensity (kWh/layer - wafer photomask) | 23.8 | 23.3 | -2.2% |
| Electricity Intensity (MJ/layer - wafer photomask) | 85.8 | 83.9 |
Investment into Renewable Energy
In 2025, Renewable energy usage to reach
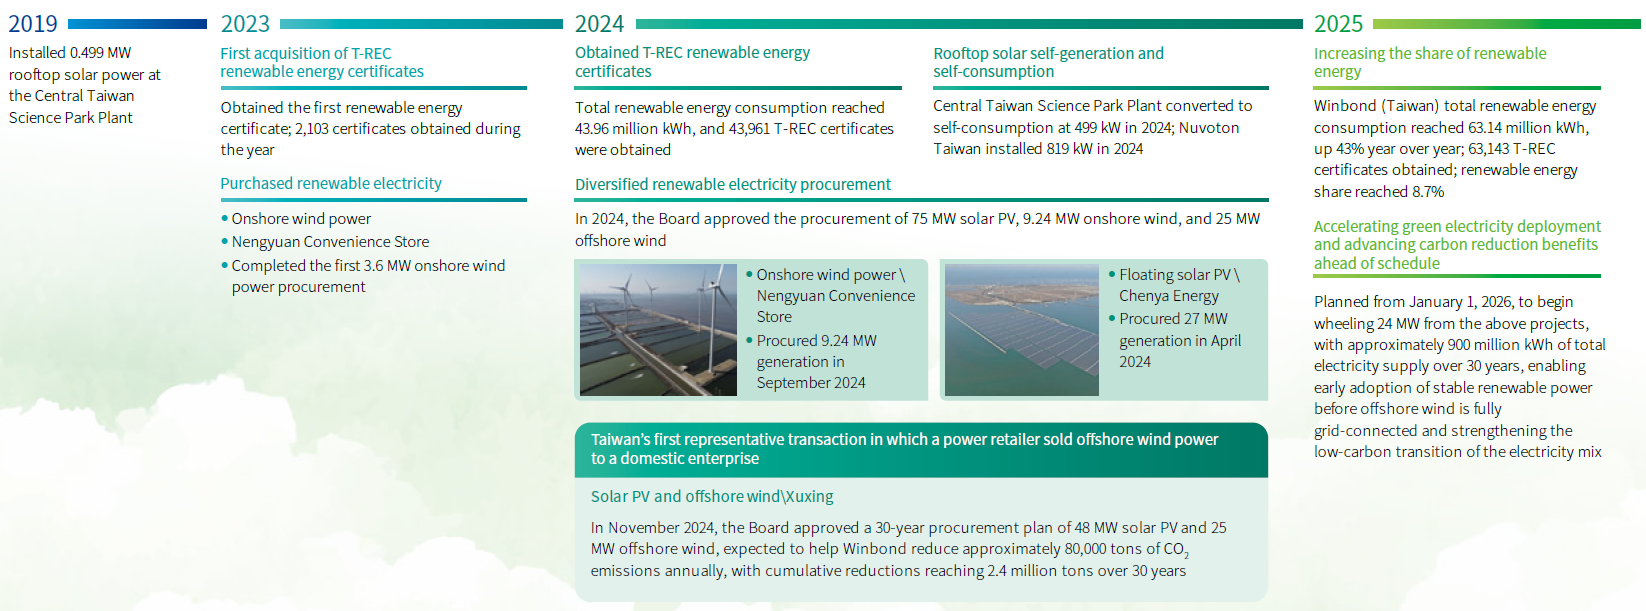
Winbond continued to expand renewable energy adoption. In 2023, its first renewable energy procurement secured onshore wind power, expected to provide close to 10 million kWh annually, exceeding the annual electricity demand of Winbond (Taiwan) service sites outside manufacturing operations.
In November 2024, Winbond’s Board of Directors approved a long-term renewable energy power purchase agreement with Sustainable Energy Solution Co., Ltd. (SES), a renewable power retailer under the Sino-American Silicon Products Group. Following completion of the R3-1 offshore wind farm, SES is expected to supply offshore wind power and solar photovoltaic (PV) electricity to Winbond. The parties launched a 30-year collaboration with a total contracted supply of approximately 4.8 billion kWh. This collaboration is expected to reduce carbon emissions by approximately 80,000 tonnes annually and deliver cumulative reductions of 2.4 million tonnes over 30 years. This represented Taiwan’s first landmark transaction in which a power retailer sold offshore wind power to a domestic enterprise, demonstrating forward-looking planning and execution along the net zero transition pathway. The agreement also extended to solar PV supply. Complementary generation profiles supported around-the-clock green power demand and strengthened progress toward sustainability and net zero targets. In 2025, Winbond accelerated green power adoption and planned to bring forward supply of 24 MW solar PV under this collaboration effective January 1, 2026, with an estimated total 30-year supply of approximately 0.9 billion kWh. This approach enabled stable renewable energy supply before offshore wind grid connection and supported the low-carbon transformation of the electricity mix.
Looking ahead, the Winbond Group will continue to assess expansion of renewable energy capacity, progressively increasing renewable energy use toward the goal of building a green enterprise.
Greenhouse gas management
Winbond actively cooperated with the government's corporate greenhouse gas inventory registration operations, implemented greenhouse gas management mechanisms within the fab, and conducted ISO 14064-1 greenhouse gas inventory using the operational control method. Winbond and its subsidiaries comprehensively promoted the inventory and verification of greenhouse gas emissions, set reduction targets, sought reduction opportunities, and proposed improvement plans.
Winbond set greenhouse gas emission reduction targets, aiming to reduce Scope 1 and Scope 2 emissions by 42% by 2030 (base year 2023). and reduce Scope 3 emissions (SBTi target range) by 25% by 2030 (base year 2023).
In 2025, Scope 1 and Scope 2 emissions were reduced by 15%. Scope 3 emissions (SBTi target range) were reduced by 8.5%. The greenhouse gas emission intensity indicator for 2025 was 11.6 kg CO2 equivalent, compared to 12.7 kg CO2 equivalent in 2024, representing a year-on-year reduction of approximately 8.7%.
Going forward, Winbond will continue to promote reductions in process gas FCs (such as process improvements and the installation of exhaust gas treatment equipment), energy conservation (process optimization, efficiency enhancement, and smart energy saving), and the use of renewable energy, as well as conducting ISO 14067 product carbon footprint assessments, to gradually improve greenhouse gas reduction performance and lower carbon emissions.
Please refer to the verification statement. Certification and Verification
GHG emission reduction targets
| Item | Unit | 2023 | 2025 | 2030 |
|---|---|---|---|---|
| Base year | Results | Target | ||
| Scope 1+Scope 2 | tCO2e | 555,276 | -15% | -42% |
| Scope 3 | tCO2e | 10,922,631 | -8.5% | -25% |
Note: The data statistics cover winbond Global (consolidated parent and subsidiary companies); Scope 3 SBTi targets emissions from purchased products and services and the usage phase of sold products.
GHG emission intensity per unit product
The greenhouse gas emission target is to reduce the greenhouse gas emission intensity per unit product by 5% YoY per year by 2030.
| 2024 | 2025 | YoY achievement status | |
|---|---|---|---|
| Intensity of greenhouse gas emissions for each product unit (kilogram of carbon dioxide equivalent/Layer - wafer photomask) | 12.7 | 11.6 | -8.7% |
Note:
- Carbon reduction targets are split into those for Scope 1 and Scope 2.
- Tier 2c calculation methods have been used to calculate the direct emissions produced by the manufacturing process in the greenhouse gas inventory report.
- The scope of data statistics is Winbond Taiwan factory.
GHG Emissions of Winbond Group
| Item | Unit | 2022 | 2023 | 2024 | 2025 | ||||
|---|---|---|---|---|---|---|---|---|---|
| Taiwan Region | Subsidiary | Taiwan Region | Subsidiary | Taiwan Region | Subsidiary | Taiwan Region | Subsidiary | ||
| Scope 1 | tCO2e | 44,373 | 36,326 | 44,149 | 55,865 | 49,316 | 40,507 | 48,536 | 40,507 |
| Scope 2 (Location-based) | tCO2e | 353,523 | 35,786 | 357,576 | 98,727 | 369,316 | 85,390 | 354,147 | 82,176 |
| Scope 2 (Market-based) | tCO2e | 353,523 | 35,786 | 356,535 | 98,727 | 346,858 | 85,390 | 314,430 | 81,374 |
| Scope 3 | tCO2e | 443,204 | 90,433 | 2,718,493 | 8,313,820 | 3,305,840 | 8,041,584 | 3,496,569 | 6,622,893 |
- Note 1: The data coverage for 2022 includes all Winbond (Taiwan) plants and Nuvoton (Taiwan); for 2023-2025, it includes all Winbond (Taiwan) plants and consolidated subsidiaries. Greenhouse gas emissions for each year have been verified by a third-party ISO 14064 standard.
- Note 2: Category 3 data includes procurement of goods and services, fuel and energy-related activities, upstream transportation and distribution, operational waste management, business travel, employee commuting, and the use of sold products (this category was added starting in 2023).