Our Focuses|Climate Change Management|Metrics and Targets
Climate Change Management
Winbond embraces the vision of being an "Be a hidden champion in providing sustainable semiconductors to enrich human life". In response to international guidelines and domestic policies geared towards green sustainability, Winbond has implemented the Task Force on Climate-related Financial Disclosures (TCFD) framework for the third year to assess the potential climate change risks and opportunities as the basis for promoting climate mitigation and adaptation actions, enhancing the company's operational resilience.


Publish the first independent TCFD report in 2023
Establish twelve Climate-Related Management Metrics
12

Metrics and Targets
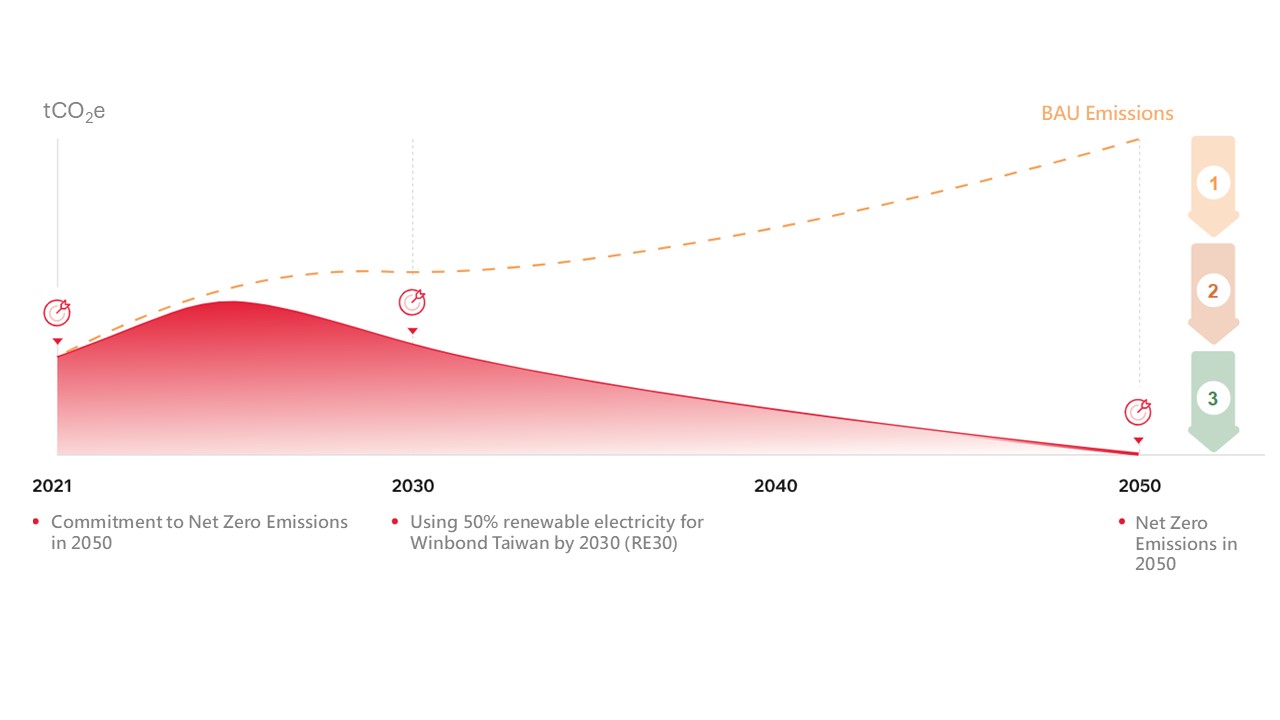
Towards Net Zero Emissions
To steadily advance towards sustainability, Winbond has combined its corporate sustainability strategy and ethos to establish short-term (by 2030), medium-term (by 2040), and long-term (by 2050) net-zero goals. Additionally, Winbond has developed a roadmap to achieve net-zero emissions by 2050 (see Figure 6) and is undertaking comprehensive actions towards achieving net-zero emissions by 2050.
1
- GHG emissions Management (GHG inventory,product carbon footprint),Energy management system, Water resource efficiency
Management System, Circular economy - Process gas reduction (increased utilization)
- New exhaust gas reduction technology
- Fluorine gas replacement technology
2
- Energy-consuming Equipment Replacement (Motors and Heating Equipment), Usage Management (Energy-saving Exhaust Systems), AI Smart monitoring (smart air conditioning)
- Renewable energy (Wind and Solar)
- Low-carbon transportation
- Low-carbon materials
- Carbon neutral natural Gas
- Hydrogen
3
- Research and implement nature-based solutions
- Research on technology-based solutions
Climate-Related Management Metrics
The introduction of the TCDF management framework and publication of TCFD report allows Winbond to assess our operational resilience in the face of climate issues. In the future, we will continue to track and monitor our climate management metrics so that we can pursue corporate growth while also working to support and protect the environment and society so that we can realize our corporate vision of “Be a hidden champion in providing sustainable semiconductors to enrich human life”.
| Category | Metric | 2024 Progress | 2025 Short-term Goal | 2030 Mid-& Long-term Goal |
|---|---|---|---|---|
Green Products
| Customer application energy-saving and carbon reduction >33% | Customer application energy-saving and carbon reduction 33%1 | Customer application energy-saving and carbon reduction >33%1 | Product lifecycle carbon emission reduction 20%2 |
| Flash memory series relative to F58s mass production | 56,000 tCO2e carbon reduction3 | 35,000 tCO2e carbon reduction3 | 110,000 tCO2e carbon reduction3 | |
Sustainable Supply Chain
| Tier-1 significant suppliers4 underwent sustainable due diligence | 100% | 100% | 100% |
| High-risk suppliers5 underwent on-site sustainable due diligences SAQ (cumulative number) | 4 | 9 | 34 | |
| Major suppliers6 disclosed the proportion of resource usage and savings | 95% | 95% | 100% | |
| Increased the localization ratio of key raw material procurement | 39% | 39.5% | 42% | |
| Environment Sustainability | Emission reduction of Greenhouse Gas (with 2023 as the baseline year) | Winbond (Taiwan) Scope 1 and 2 GHG emissions reduction 1.1% | Winbond (Taiwan) Scope 1 and 2 GHG emissions reduction 2.5% | Winbond (Taiwan) Scope 1 and 2 GHG emissions reduction 42% |
| Total electricity saving | The annual electricity savings were 3.5% | 2~3% Annual electricity savings | Cumulative electricity savings over 15% | |
| Fab-wide water recycling rate | 81.9% | ≧ 80% | ≧ 80% | |
| Renewable energy usage rate | 5.9% in Winbond (Taiwan) | - | Achieve 50% renewable energy in Winbond (Taiwan) | |
| Climate Change Risk | Production disruptions caused by climate disasters (day) | 0 day | 0 day | 0 day |
Note:
1. This calculation was based on 25nm 1.2V/128Mb HyperRAM product.
2. Calculations were based on the entire range of dynamic random-access memory (DRAM) products including the process evolution.
3. Calculations were based on the entire range of flash memory products including the process evolution.
4. Tier-1 significant suppliers refer to those who directly trade with Winbond, providing products/services/technologies directly related to production and manufacturing, with an annual procurement amount exceeding NT$10 million.
5. High-risk suppliers refer to those comprehensively determined through sustainable due diligence and sustainable written audits to require on-site audits and guidance to reduce sustainability risks.
6. Major suppliers refer to those directly related to Winbond's Scope 3 emission category 4 (inventory standards based on ISO 14064:2018).