Our Focuses|Climate Change Management|Mitigation and Adaptation Measures
Climate Change Management
Winbond embraces the vision of being an "Be a hidden champion in providing sustainable semiconductors to enrich human life". In response to international guidelines and domestic policies geared towards green sustainability, Winbond has implemented the Task Force on Climate-related Financial Disclosures (TCFD) framework for the third year to assess the potential climate change risks and opportunities as the basis for promoting climate mitigation and adaptation actions, enhancing the company's operational resilience.


Publish the first independent TCFD report in 2023
Establish twelve Climate-Related Management Metrics
12

Mitigation and Adaptation Measures
Note:
1. The baseline year for supply chain carbon reduction is 2021, including actual reporting or approval by third-party verification units.
2. Completion of Winbond ESG interactive network (https://sscm.winbond.com/)
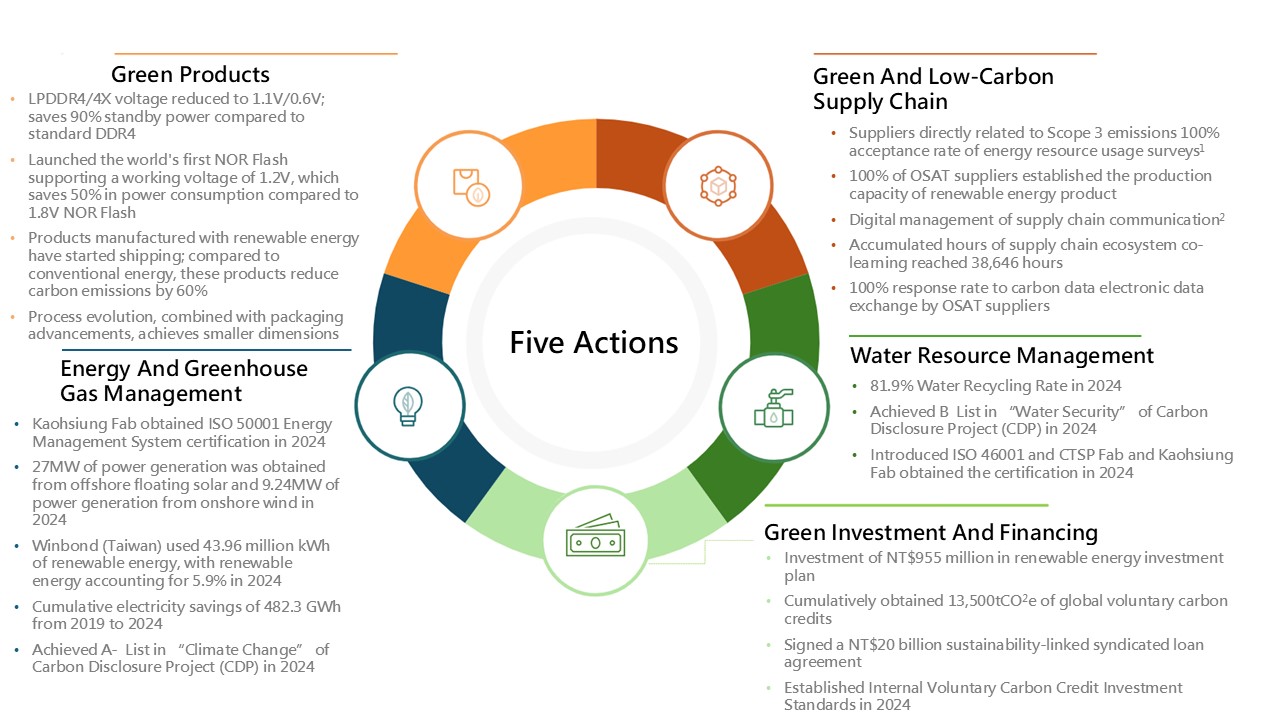
3. For details, please refer to the chapters on Green Product, Sustainable Supply Chain, Energy and Greenhouse Gas Management, and Water Management. For actions related to Green Investment and Financing, please see below.
Green Investment and Financing
Green Investment and Sustainability-Linked Loan
The whole world is facing the impact of climate change. As one of Taiwan’s intensive electronics industry, we set up a green investment management unit to achieve the goal of green investment and create long-term value for investors and shareholders.
Green Energy Investment
- In May 2022, Winbond acquired 15% equity in CHIA-HO Green Energy Corporation for NT$555 million, whose main business is to develop solar energy fields. Considering that its parent company, Taiwan Cement Corporation, has valuable practical experience in the renewable energy industry.
- In May 2024, Winbond participated in the joint establishment of Kai-Hong Energy Co., Ltd., with an expected
investment of NT$ 400 million. Kai-Hong Energy's primary business involves investing in solar power generation and wind power generation infrastructure projects in Taiwan.
![]()
NT$955 million renewable energy investment plan
Cumulative investments in renewable energy development from 2022 to 2024, aiming to diversify power supply sources and increase investment returns.
Global Voluntary Carbon Credits
- In response to the global carbon neutrality trend and the 2050 net-zero goal, Winbond not only joined the Singapore Internationa Carbon Exchange (CIX) in 2022 and continued to participate in international carbon trading, but also became the first international carbon purchaser on the Taiwan Carbon Exchange (TCX) in 2023.
- By the end of 2024, Winbond had cumulatively acquired 13,500 metric tons of voluntary carbon credits from 9 countries in Asia and Africa.
.svg)
Sustainability-Linked Loan
- In April 2023, Winbond signed a NT$20 billion sustainability-linked syndicated loan agreement,
incorporating specific indicators for carbon reduction, energy saving, and corporate governance
into the evaluation criteria. The actual performance of these sustainability indicators was regularly
audited, and the results were rewarded to interest rate deduction. In June 2024, the bank confirmed
that Winbond had achieved its annual sustainability targets for two consecutive years, resulting in
a reduction of NT$1.89 million in interest expenses for 2024.